Investigating the impact of recording same day emergency activity (SDEC) in the emergency care data set (ECDS)
18 Nov 2025
18 Nov 2025
The following blog article is authored by the Data Science Team at Telstra Health UK, which is part of Telstra Health, a global provider of digital solutions and services to healthcare providers and governments, committed to delivering digital health solutions that improve patient outcomes and streamline healthcare delivery.
Same Day Emergency Care (SDEC) is the provision of same day care for emergency patients who would otherwise be admitted to hospital. It aims to improve the healthcare system by, where appropriate, reducing waiting times and hospital admissions.
Patients presenting at hospital with relevant conditions are assessed, diagnosed, and treated within a SDEC department without being admitted to a ward. If clinically safe, the aim is for patients to be discharged from hospital to their home on the same day.
To better understand the impact of introducing SDEC, NHS England has mandated that all SDEC activity is recorded and submitted as part of Emergency Care Data Set (ECDS) data submission rather than as part of the inpatient dataset. Originally mandated from 1 July 2024, the deadline for SDEC to be recorded and submitted was updated to 1 July 2025 to give trusts more time to ensure recording systems were in place.
Several organisations have already moved — or are in the process of moving —to recording activity within the ECDS, either as part of a pilot programme or in preparation for future requirements. As more trusts follow, it is important to understand the impact this change in recording could have on frequently used inpatient metrics, such as mortality ratios, readmission risk and average length of stay.
Telstra Health UK originally investigated the potential impact of changes to recording in 2020[1]. To capture any changes since this report was completed, the analysis has been re-run based on the latest complete financial year data available (UK financial year 2023/24).
To understand the effect of moving SDEC activity to the ECDS, admissions that were potentially SDEC activity were removed from the inpatient dataset and the indicators, such as the hospital standardised mortality ratio (HSMR) recalculated. The underlying model coefficients were not recalculated with SDEC activity removed.
There are multiple approaches to identifying potential SDEC activity within the Hospital Episode Statistics (HES) inpatient dataset, as different trusts adopt varying service models for delivering SDEC. These variations will impact how the activity is recorded, therefore it is difficult to establish a definitive definition of SDEC. Since the original analysis was produced by Telstra Health UK, NHS Digital produced a report on the impact of SDEC recording on inpatient HES data[2]. The definitions used in this report were broader than the ones used in Telstra Health UK’s initial research.
| Original (2020) | Based on NHSD (2023) | |
| Spell Length of stay | 0 | 0 |
| Admission type | Non-elective | Non-elective via A&E |
| Trust type | Acute non-specialised | Acute non-specialised |
| Primary Diagnosis codes | SDEC 100 Registry list | Any |
| Spell Treatment Function Code | Any | 100, 180, 300, 326, 420, 430[3] |
| Exclusions | Death in hospital Transfers in or out to another trust |
Death in hospital Transfers in or out to another trust |
In the ‘Same day emergency care – service specification’ document[4], the following definition was included.
The percentage of admissions identified as potential SDEC activity using the two definitions are shown in the table below.
Number of admissions identified as potential SDEC activity.
| Original (2020) | Based on NHSD (2025) | |
| % of all episodes recorded admissions | 1.7% | 3.4% |
| % of all episodes recorded as non-elective admissions | 7.5% | 14.8% |
As expected, the more general definition of SDEC (NHSD version) resulted in a larger percentage of admissions being potentially categorised as SDEC. We received feedback from some of our customers that the percentage identified in the original analysis may be too low as they would expect more of the activity to move over to SDEC; for this reason, the newer, broader definition has been used in the following analysis.
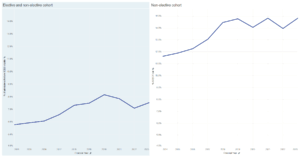
The trend for percentage of all admissions which are potentially SDEC activity has generally increased since the UK financial year 2014/2015. There are some fluctuations caused by the COVID-19 pandemic, as this impacted levels of elective activity.
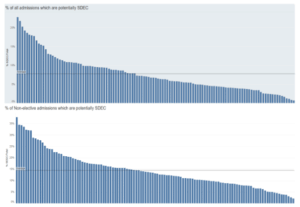
When looking at the data from a provider level, there is wide variation in the percentage of all admissions which could be categorised as SDEC, with figures ranging from 1% to 23%. When focussing on non-elective admissions, the percentage that could potentially be SDEC ranges from 2% to 38%.
While some of this variation may be due to some trusts already recording their activity in the EDCS dataset, there is still a notable variation in the potential levels of SDEC activity between trusts. The proportion of admissions likely to be SDEC in the inpatient dataset could be tracked over time, as we would expect to see these percentages to decrease as activity recording changes from the inpatient dataset to EDCS.
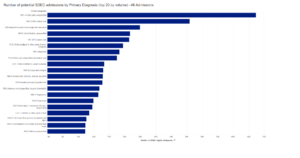
When looking at the primary diagnosis of potential SDEC activity, the most common diagnoses coded are chest pain (unspecified and other), respiratory infection (unspecified) and viral infections (unspecified).
The bar charts in this section show the provider-level effect and variation of removing potential SDEC activity from the inpatient admissions dataset for FY2023/24 on the following key metrics:
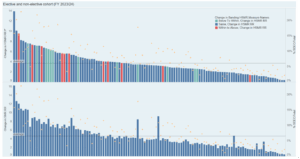
HSMR and SMR
When potential SDEC activity is removed from the dataset, the relative risk for HSMR and SMR increases for all trusts. The average increase in HSMR across all trusts is 3.7, with a range of 13.9 to 0.4. This is expected as the observed number of deaths remains the same as any deaths were excluded from the potential SDEC cohort (as per the definition table above), effectively maintaining the numerator whilst reducing the denominator. The expected number of deaths decreases because a large number of spells have been removed from the calculation, all of which would have had a small, non-zero mortality risk contributing to the expected number of deaths.
As well as showing the potential increase in HSMR, the graph below shows the impact on the trust’s HSMR banding. This analysis provides estimates on the impact based on a broad definition of SDEC, therefore it is likely to be on the higher end. The coding change may be introduced over time, thus any impact may be seen gradually. In this analysis, the model has not been rerun with SDEC activity removed, however a shift in activity recording nationally is likely to be reflected in the model’s year variable over time. The impact then lessens over time as the model adjusts to reflect the removal of SDEC activity. Currently, it is not possible to determine how long the model will take to adjust to any changes, due to the numerous uncertainties surrounding the timing of the recording changes.
There are 11 trusts, highlighted in red, which could see their band move from ‘within expected’ to ‘above expected’. A further 12 could see their band move from ‘below expected’ to ‘within expected’ (highlighted in light blue). It is worth noting this is based on a broad definition of potential SDEC activity, therefore it likely represents the highest possible impact of removing SDEC activity. If there is a shift nationally in the underlying data used to calculate the model coefficients, then it is likely the model will adjust over time to lessen the impact.
In the diagram below, the orange dots illustrate the percentage of potential SDEC activity labelled as admissions at each trust. The impact on HSMR decreases with a lower percentage of SDEC activity , however there is variation between the trusts. This variation is due to the casemix of the admissions identified as SDEC which varies between trusts.
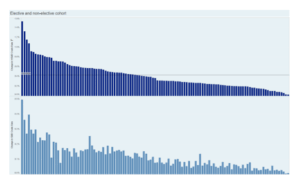
Crude mortality rates
As seen with HSMR and SMR, all trusts show an increase in crude mortality rates. This occurs because SDEC are excluded from the total number of spells (denominator) while the observed number of deaths (numerator) remains unchanged. The effect on crude rates differs between trusts but is closely related to the percentage of admission that were actually SDEC activity. The higher the percentage of SDEC, the greater the impact on crude mortality rates.
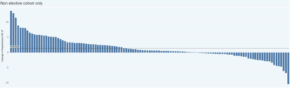
Readmission relative risk
The impact on 28-day readmission relative risk is more variable, with some trusts seeing an increase in the relative risk and others seeing a decrease. This variation is due to the removal of SDEC activity affecting both actual and expected readmission figures, and the impact differs from trust to trust. Overall for all admissions, the average change in readmission risk is 0.46 and for non-elective admissions only, it is 1.36.
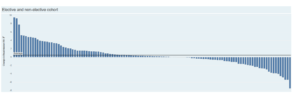
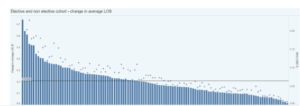
Average length of stay
Since a criterion for SDEC activity was a zero-day length of stay, the average length of stay is expected to increase once these are removed from the calculation. The average overall impact on length of stay was an increase of 0.2 days when looking at all admissions, and this was 0.76 days when considering non-elective admissions only. The graph below shows the change in average length of stay by provider. The dots on the first graph indicate the percentage of recorded admissions that were actually SDEC activity for the trust. As expected, the graph generally shows the higher the % of SDEC , the greater the impact on length of stay (LOS).

It is clear the migration of SDEC activity within the ECDS dataset, as opposed to the inpatient dataset will have an impact on several current inpatient metrics. HMSR, SMR and crude rates are likely to increase once the change in coding is implemented.
This analysis was conducted based on currently available information regarding definitions for SDEC activity. There is not one standard definition of SDEC activity available as it varies between trusts. Once the change in coding practice is fully implemented, the resulting differences in these metrics may vary from our current estimates, either being larger or smaller. Additionally, trusts may adopt the change gradually, in which case the full impact may only become apparent over time.
Other influencing factors could include variations in patient admission rates, opening times of the SDEC unit or the specific pathways implemented for SDEC services by individual providers. The analysis may also miss some SDEC eligible admissions, such as patients who are currently admitted to hospital for an overnight stay (LOS > 0) but are treated and discharged on the same day.
The SDEC model can be implemented in many ways across different providers, and therefore it is difficult to assess as a whole and draw comparisons between providers. To define best practice, hospitals using similar services could be grouped together, which would enable us to see which methods are the most effective and potentially provide evidence for policy reform.
Acute providers must consider which metrics to measure when they are recording SDEC activity, such as SDEC conversion rates, SDEC LOS rates, admission rates from SDEC, impact on A&E wait time and clinical and patient outcomes. Monitoring the cost of delivering care through SDEC compared to current services can help assess the financial sustainability and efficiency of the service.
For these reasons, it would be beneficial for analyses to be undertaken by individual providers to better understand their specific SDEC services. With access to local data and knowledge, Telstra Health can assist with this by providing bespoke interactive dashboards, developing process and activity metrics and analytical support to fully quantify the impact.
Find out more about how Telstra Health can assist with this type of analysis here.
[1] Examining the impact of recording same day emergency care activity in the emergency care data set — Telstra Health UK
[2] Impact of changes to recording of Same Day Emergency Care Activity on Hospital Episode Statistics (HES) data – NHS England Digital
[3] TFC: 100 General Surgery, 180 Emergency Medicine, 300 General Internal Medicine, 326 Acute Internal Medicine, 420 Paediatrics, 430 Geriatric Medicine
[4] https://www.england.nhs.uk/long-read/same-day-emergency-care/#5-activity-recording
Get the latest insights and updates from Telstra Health UK.
View now