Examining the impact of recording same day emergency care activity in the emergency care data set
12 Feb 2020
12 Feb 2020
Under this model, the focus is on enabling clinicians to make early decisions so that a patient referred or presenting to an acute hospital with a relevant condition can be rapidly assessed, diagnosed and treated without being admitted to a ward. A new access standard for utilising SDEC was proposed by NHS England in its review in 2019 to avoid overnight admissions and improve patient flow.[1] The conditions that can be managed through SDEC vary depending on the hospital and needs of the local population, but can include pulmonary embolus, pneumonia, atrial fibrillation, ankle fractures, bleeding in early pregnancy, gastroenteritis in children, syncope, and falls.
The NHS recognises that access to timely and accurate data enables more effective decision making. The emergency care data set (ECDS) was developed in 2017 to help provide insight into how and why people attend emergency care departments and drive improvements in care delivery. The NHS will be implementing changes to the way providers record SDEC activity, seeking to move this from inpatient and outpatient data and instead incorporating it within the ECDS. The timescales for implementing these changes have not been clarified yet.
Any changes to coding practices have the potential to affect the indicators that trusts rely on as measures of safety, quality and efficiency. When this happens, it is important to ascertain whether fluctuations are due to coding changes or issues within the system that need to be addressed.
Dr Foster analysts have explored the potential impact of the change on frequently used inpatient metrics such as mortality ratios, readmission risk, and average length of stay.
[1] Clinically-led Review of Access Standards: Interim Report from the NHS Medical Director, NHS England, March 2019
To create the effect of moving SDEC activity to the ECDS, Dr Foster’s analysts removed estimated SDEC-eligible admissions from the inpatient dataset and calculated the same indicators as normal.
For the purpose of this analysis, an SDEC attendance was defined as a spell where the patient had an SDEC-eligible primary diagnosis code that was investigated and/or treated on the day of presentation. Analysts used the diagnosis codes and ages suggested by the SDEC 100 Registry to define emergency inpatient admissions that may be eligible for SDEC.
All activity was limited to admissions from acute, non-specialist trusts, and records where risk-adjusted mortality or readmission outcomes could not be calculated due to missing data fields were excluded from the overall cohort. Admissions where the patient was not discharged on the same day that they were admitted, where patients died during admission, and where the patient was transferred to or from another provider were also excluded from the SDEC-eligible group.
SDEC ICD10 codes were grouped into 15 systems that were categorised as either medical or surgical for the purpose of the analysis. The analysis was applied to two separate denominators. One cohort included all (elective and non-elective) admissions, illustrated in graphs with a pale blue background and the other cohort was emergency (non-elective) admissions only. These graphs have a white background throughout.
You can find out more about our methodology here
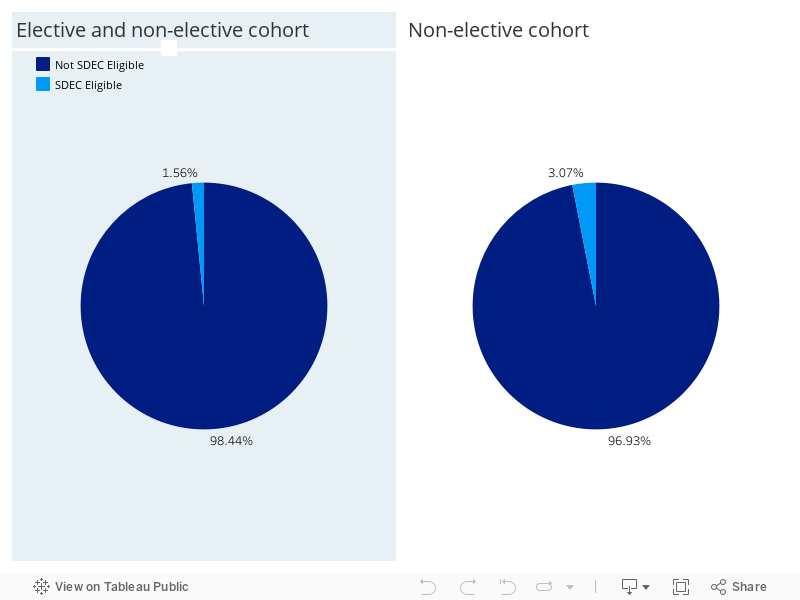
In the 2018/19 financial year, we estimated that SDEC-eligible admissions represented
1.6 per cent of all admissions nationally and 3.1 per cent of all non-elective admissions. The latter proportion is approximately double the former because removing elective admissions from the cohort (denominator) decreases the population by half. The SDEC-eligible admissions (numerator) represent the same patients in both pie charts in Figure 1.
The graphs in Figure 2 show the general trend of the national annual percentage of all admissions that are SDEC eligible. The general trend of all SDEC-eligible admissions gradually increased from 1.2 per cent in 2009 to 1.6 per cent in 2018 for the larger cohort of elective and non-elective admissions. Again we see the trend increasing for the smaller cohort of emergency admissions over the last ten financial years.
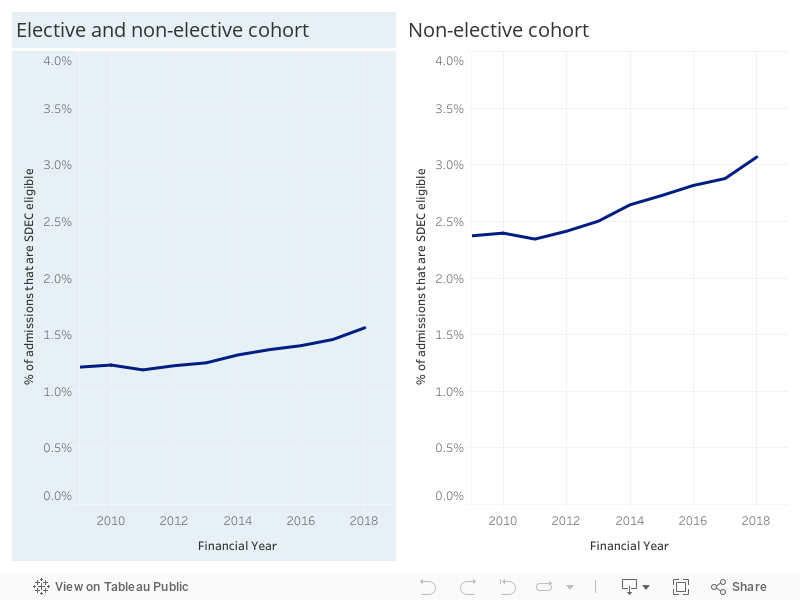
Figure 3 shows the national volume of SDEC-eligible admissions in FY18/19 split by the system of the primary diagnosis. Generally, the most common primary diagnoses of SDEC-eligible admissions were medical issues falling into one of the following categories: infectious, cardiology or respiratory conditions. The least common SDEC-eligible admissions were due to a rheumatology/orthopaedic condition.
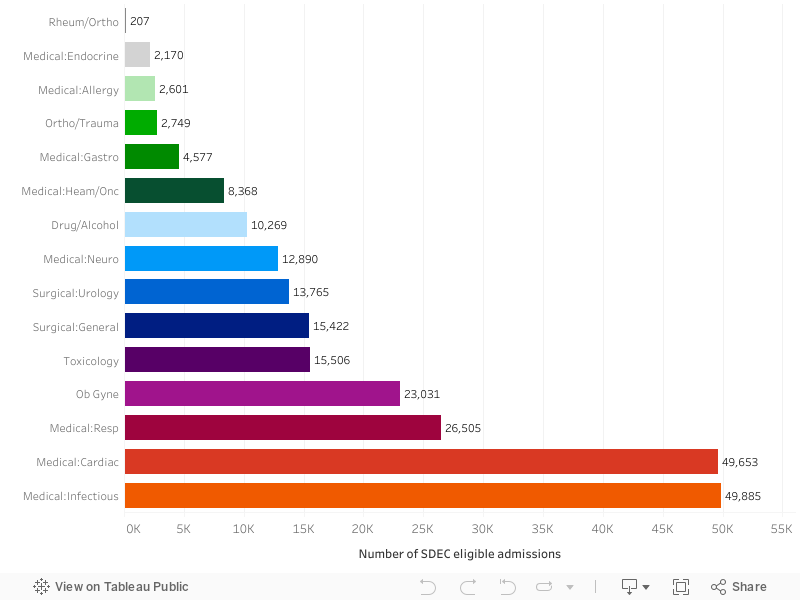
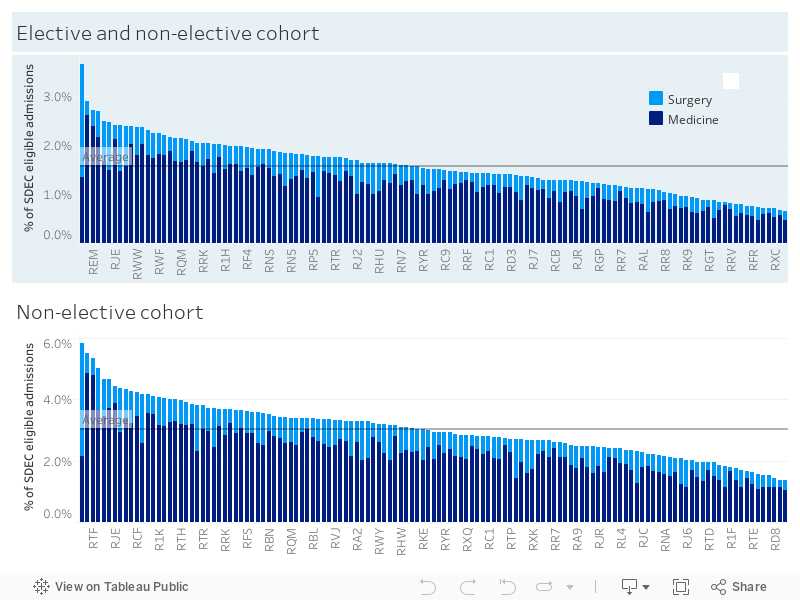
Figure 4 shows the provider-level percentage of all admissions and of non-elective admissions that are SDEC eligible split by medical or surgical system of the primary diagnosis for FY18/19. More SDEC-eligible admissions were attributable to medical conditions than surgical conditions overall. At trust level, the percentage of all SDEC-eligible admissions varied, ranging from 3.7 per cent at Walsall Healthcare NHS Trust to 0.6 per cent at King’s College Hospital NHS Foundation Trust. The average percentage of admissions that are SDEC eligible across all providers is 1.6 per cent. A similar trend is seen for the non-elective admissions only cohort.
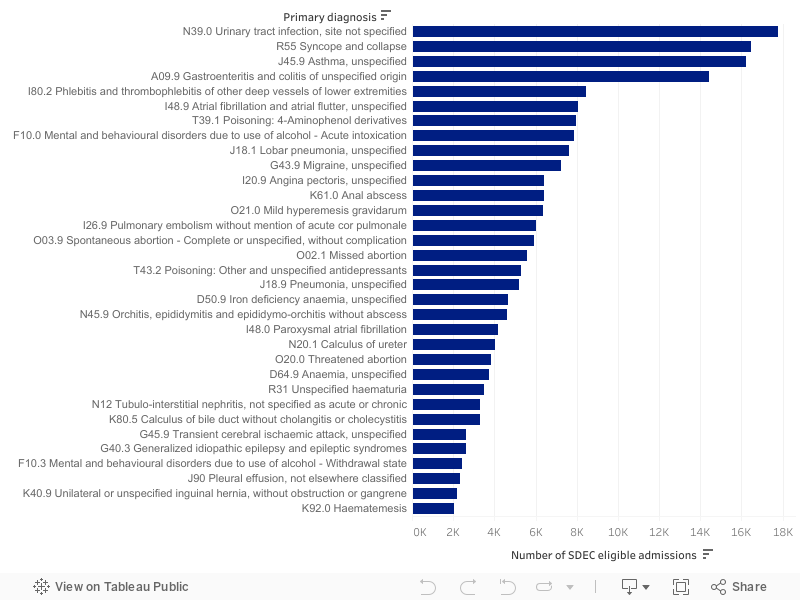
The bar chart in Figure 5 shows the national number of SDEC-eligible admissions in FY18/19 for each ICD10 primary diagnosis where the number of SDEC-eligible admissions was greater than 2000. On the bar chart, 33 out of 78 total primary diagnosis are represented. By far, the most frequent SDEC-eligible admission diagnosis was urinary tract infection, with 17,762 admissions that met the SDEC criteria, nationally in FY 2018/19. This was followed by syncope and collapse, asthma and gastroenteritis and colitis of unspecified origin. These rankings will vary between individual providers.
The bar charts in Figure 6 show the provider-level effect and variation of removing SDEC- eligible admissions from the inpatient dataset, for the two cohorts of admission types, in FY 2018/19 on the following key metrics:
When SDEC-eligible admissions were removed from the dataset, the relative risk for HSMR and SMR was found to be higher for all trusts. The 28-day readmission relative risk was more variable, with approximately half of providers showing an increased relative risk and half showing a reduction in their relative risk. Since a criterion for SDEC admissions was a zero-day length of stay, average length of stay is expected to be increased, and the average overall impact on length of stay was an increase by 0.1 days when looking at emergency admissions only.
Displayed in the top right corner of each bar chart within Figure 6 is the number of hospitals where the banding changed after the removal of SDEC-eligible admissions, out of a total of 131 providers. Since the numbers are small, ranging from four to eleven, the analysis demonstrates that there are likely to be few instances where the banding is altered, for example from expected to above expected, for HSMR, SMR and 28-day readmissions after the removal of SDEC activity from the inpatient dataset.
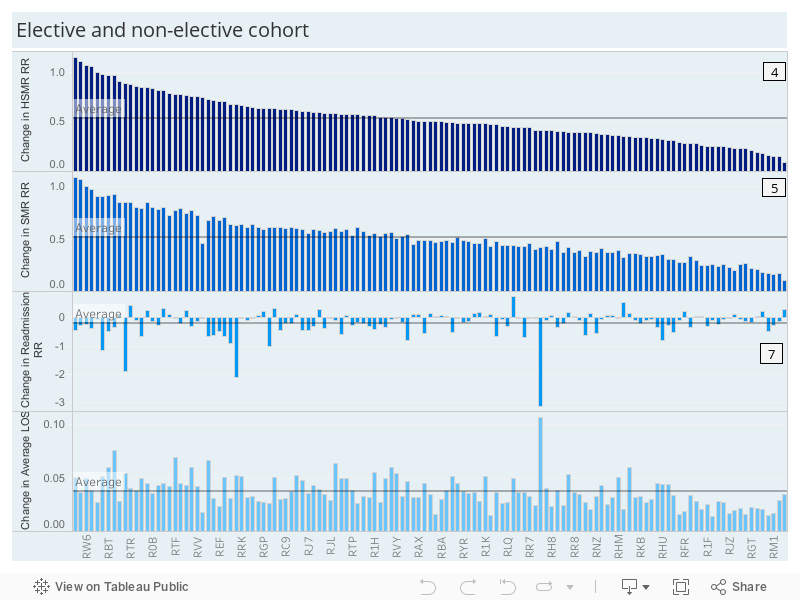
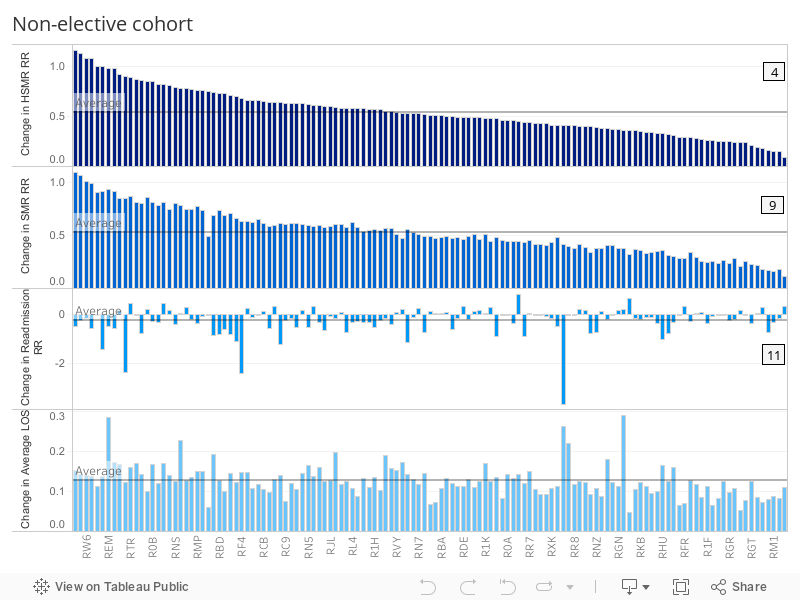
Displayed in the top right corner of each bar chart is the number of hospitals where the banding changed after the removal of SDEC-eligible admissions e.g. from within expected range to above expected.
This analysis was based on the coding list produced by the NHS from the SDEC 100 registry of SDEC-eligible conditions. The list of conditions most frequently seen in an SDEC unit is likely to vary between providers so, after the change in coding practice, the differences to these metrics may be larger or smaller than Dr Foster’s estimations.
In addition to this, we are capturing SDEC-eligible admissions, which includes some missed opportunities for SDEC admissions, and will miss some SDEC admissions where the patient was admitted to hospital for an overnight stay (length of stay >0) which hospitals estimate to be the case 10-15% of the time.[1]
The impact of including SDEC activity in the ECDS will also vary significantly if the proportions of patients seen in SDEC varies between providers. Other factors could impact the metrics such as the rate at which providers admit patients or how specific patient pathways are implemented for their SDEC service.
For these reasons, it would be beneficial for analyses to be undertaken by individual providers in order to better understand their specific SDEC services. Dr Foster can assist with this by providing bespoke interactive dashboards, ongoing monitoring and analytical support to fully quantify the impact.
The SDEC model can also be implemented in many ways across different providers and it is, therefore, difficult to assess as a whole and make comparisons between providers. In order to define best practice, hospitals using similar services could be grouped together, which would enable us to see which methods are most effective.
Acute providers must consider which metrics to measure when they are recording SDEC activity. In the document Same-day emergency care: clinical definition, patient selection and metrics, NHS England and NHS Improvement suggest a number of useful metrics for gaining insight into SDEC unit performance. With access to local ECDS data, Dr Foster could assist acute providers by helping with process and activity measure, impact measure, and balancing measure.
It could also be valuable for providers to assess the wider impact of their SDEC activity, by monitoring the cost savings generated by treating non-elective patients in SDEC and how an increase in SDEC activity affects average time spent in accident and emergency for admitted non-SDEC patients.
[1] Same-day emergency care: clinical definition, patient selection and metrics, NHS Improvement and the Ambulatory Emergency Care Network, April 2019
Get the latest insights and updates from Telstra Health UK.
View now