COVID-19 Hotspot Indicator
12 Aug 2020
12 Aug 2020
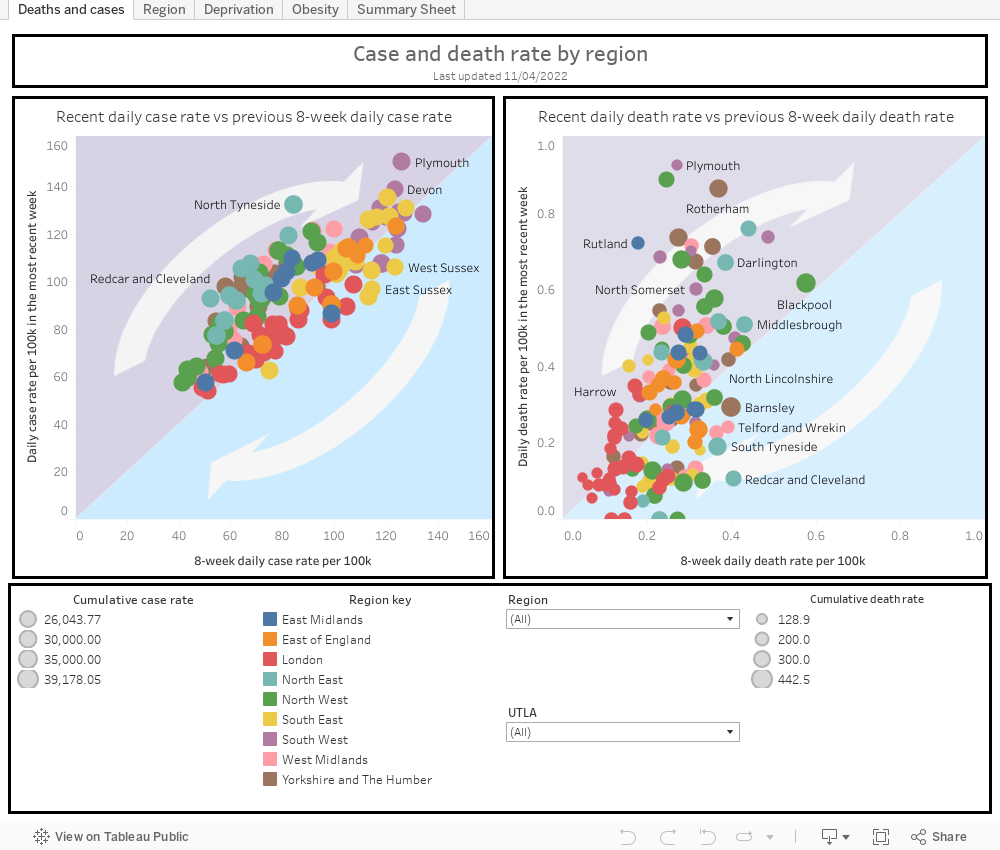
The interactive graph allows public health teams to monitor any increases in COVID-19 cases and deaths by recent daily rates compared to a prior eight-week daily rates. It provides an early indication of a potential spike in cases, allowing local authorities to act early and implement restrictions.
The graph can be adjusted to filter on specific UTLAs and by Region. Further UTLAs are coloured by region, deprivation or obesity. By monitoring the case rate, teams can pre-empt increases in hospitalisations and deaths. Furthermore, regularly reviewing these charts is likely to suggest a lagged correlation between cases and deaths. Observing this change might further suggest the effectiveness of the vaccination programme.
Dr Foster has developed a number of solutions to support trust in understanding COVID-19 activity and mortality at their trust and in comparison to peers. This includes a risk-adjusted benchmark for COVID-19 mortality, which allows trusts to compare their mortality risks nationally and to peers using a bespoke COVID-19 standardised mortality ratio.
For further information, please contact us at info@drfoster.com.
Get the latest insights and updates from Telstra Health UK.
View now